Bitcoin News
Bitcoin and these 4 altcoins are showing bullish signs
Cryptocurrency markets lack any signs of volatility going into the year-end holiday season. This suggests that both the bulls and the bears are playing it safe and are not waging large bets due to the uncertainty regarding the next directional move. This indecisive phase is unlikely to continue for long because periods of low volatility are generally followed by an increase in volatility.
Willy Woo, creator of on-chain analytics resource Woobull, anticipates that the duration of the current bear market may “be longer than 2018 but shorter than 2015.”

Crypto market data daily view. Source: Coin360
The crypto winter has resulted in a loss of more than $116 billion to the personal equity of 17 investors and founders in the cryptocurrency space, according to estimates by Forbes. The carnage has been so severe that the names of 10 investors were removed from the crypto billionaire list.
Could the bear market deepen further or is it showing signs of starting a relief rally? Let’s look at the charts of Bitcoin (BTC) and select altcoins to find out.
BTC/USDT
Bitcoin has been trading in a tight range near the 20-day exponential moving average (EMA) of $16,929 for the past few days. This indicates that the bears are defending the level, but the bulls have not given up yet.

BTC/USDT daily chart. Source: TradingView
This period of calm is unlikely to continue for long and the BTC/Tether (USDT) pair may soon witness a range expansion. Generally, it is difficult to predict the direction of the breakout, hence it is better to wait for the pair to make a decisive move before initiating directional bets.
If the price breaks above the moving averages, the likelihood of a rally to the overhead resistance at $18,388 increases. This level may again act as a major roadblock, but if the bulls force their way through, the momentum could pick up and the pair could rally to $20,000.
On the way down, a break below $16,256 could signal that bears are in control. The sellers will then attempt to sink the pair to the vital support at $15,476.

BTC/USDT 4-hour chart. Source: TradingView
Both moving averages on the 4-hour chart have flattened out and the relative strength index (RSI) is just below the center. This suggests a range-bound action in the near term. The boundaries of the range could be $17,061 on the upside and $16,256 on the downside.
A break above $17,061 will indicate that the bulls have come out on top and that could start a short-term up-move. On the other hand, a slump below $16,256 will suggest that the bears have strengthened their hold.
ETH/USDT
Ether (ETH) has been clinging to the 20-day EMA of $1,228 for the past few days. This suggests that traders expect a break above this overhead resistance.

ETH/USDT daily chart. Source: TradingView
The 20-day EMA is flattening out and the RSI is just below the midpoint, suggesting equilibrium between buyers and sellers. If the bulls thrust the price above the moving averages, the ETH/USDT pair could attract further buying. The pair could then rally to $1,352 and later to the downtrend line. This level could again act as a formidable resistance.
On the contrary, if the price fails to break above the moving averages, several short-term traders may sell aggressively. That could pull the price to the strong support at $1,150. If this level gives way, a head-and-shoulders pattern may be complete. That could clear the path for a potential drop to $1,075 and then $948.

ETH/USDT 4-hour chart. Source: TradingView
The 4-hour chart shows that the recovery is facing resistance in the zone between the 38.2% Fibonacci retracement level of $1,227 and the 50% retracement level of $1,251. If the price turns down and breaks below $1,180, the pair could retest the important support at $1,150.
Conversely, if the price turns up and breaks above $1,251, the rally could reach the 61.8% retracement level of $1,275. If the bulls manage to clear this obstacle, the pair may complete a 100% retracement and soar to $1,352.
TON/USDT
Toncoin (TON) has been consolidating in an uptrend for the past few days. Although the bears have stalled the up-move at $2.90, a minor positive is that the bulls have not given up much ground. This suggests buying on dips.

TON/USDT daily chart. Source: TradingView
The rising 20-day EMA of $2.25 and the RSI in the positive territory indicate that th bulls have the upper hand. If buyers push the price above $2.50, the TON/USDT pair could rise to $2.65 and then retest at $2.90.
The bears are likely to have other plans as they will try to yank the price below the 20-day EMA and strengthen their position. There is minor support at $2.15 but if that fails to hold, the pair may plummet to the 50-day simple moving average (SMA) of $1.91.

TON/USDT 4-hour chart. Source: TradingView
The pair has formed a symmetrical triangle on the 4-hour chart. This indicates indecision between the bulls and the bears. The flattish moving averages and the RSI near the midpoint also do not give a clear advantage to anyone.
The first sign of strength will be a break and close above the resistance line of the triangle. That could start a rally to $2.90. If this level is scaled, the up-move could reach the pattern target of $3.24.
If the price turns down from the 50-SMA or the resistance line of the triangle, it will suggest that the pair may extend its stay inside the triangle. A break below the support line could indicate that the bears are back in control.
Related: The 5 most important regulatory developments for crypto in 2022
XMR/USDT
Monero (XMR) has failed to rise above the resistance line of the falling wedge pattern in the past few days, but a positive sign is that the bulls are trying to hold the price above the 50-day SMA of $140.

XMR/USDT daily chart. Source: TradingView
The moving averages have flattened out and the RSI is near the center. This indicates a balance between supply and demand. If the price breaks above the 20-day EMA of $144, buyers will try to gain the upper hand by pushing the XMR/USDT pair above the wedge. If that happens, the pair could rally to $174. A break above this level could signal a potential trend change.
On the other hand, if the price slumps below $138, the advantage could tilt in favor of the bears. The pair could then plummet to $125.

XMR/USDT 4-hour chart. Source: TradingView
The pair rebounded off the strong support at $138.50 and the bulls are trying to push the price above the moving averages. If they succeed, the pair could rise to the downtrend line, where the bears may again mount a strong defense.
If the price turns lower from the downtrend line, the bears will try to pull the pair to $138.50. This is an important level to keep an eye on in the near term because a break below it could complete a descending triangle pattern. The pair could then tumble to $132 and thereafter to the pattern target of $124.
On the upside, a break above the downtrend line could invalidate the bearish setup and clear the path for a possible rally to $153.
OKB/USDT
Centralized Cryptocurrency exchanges have been in the eye of the storm since the collapse of FTX but OKB (OKB) is close to completing a bullish reversal pattern. That is the reason for its selection to the list.

OKB/USDT daily chart. Source: TradingView
The OKB/USDT pair has formed a large inverse head-and-shoulders pattern, which will complete on a break and close above $23.22. Both moving averages are sloping up and the RSI is in the positive territory, indicating the path of least resistance is to the upside.
If the price rises above the psychological level of $25, the pair could start a new up-move to $28 and then $31. The pattern target of the reversal formation is $36. This positive view could invalidate if the price turns down from the current level and plummets below the moving averages. The pair could then drop to $17.

OKB/USDT 4-hour chart. Source: TradingView
The pair has formed an ascending triangle pattern on the 4-hour chart. This bullish setup will complete on a break and close above $24.15. If that happens, the pair could start a new up-move toward the pattern target of $31.
Alternatively, if the price turns down and breaks below the triangle, it will invalidate the bullish setup. That could trigger stops of aggressive buyers who may have taken long positions in anticipation of a breakout. The pair could then slide to $20.
This article does not contain investment advice or recommendations. Every investment and trading move involves risk, and readers should conduct their own research when making a decision.


Nomura Digital Assets, a subsidiary of Japan’s leading financial institution, Nomura Group, has ventured into the world of digital assets with the launch of a Bitcoin fund. This strategic move is designed to streamline access to digital assets for major investors, responding to the escalating demand for cryptocurrency investments. It marks Nomura’s maiden foray into providing investment solutions tailored to the digital asset arena.
In a press release dated September 19, Laser Digital Asset Management, the digital asset management arm of Nomura, proudly introduced the Bitcoin Adoption Fund, a specialized offering aimed squarely at institutional investors. This fund underscores the growing breadth of cryptocurrency adoption in Japan.
Facilitating Bitcoin Uptake
The Laser Digital Bitcoin Adoption Fund offers institutional investors an attractive proposition, blending cost-efficiency with robust security measures. In a bid to safeguard the fund’s holdings, Laser has enlisted the services of Komainu, a custody solution established in 2018, which is subject to regulatory oversight and jointly formed by Nomura, Ledger, and Coinshares.
Fiona King, the head of Laser Digital Asset Management, emphasized the fund’s meticulous management and compliance standards. Notably, the fund operates as a segregated portfolio within the mutual fund entity, Laser Digital Funds SPC.
Nomura Holdings foresees that its crypto-focused division, Laser Digital, will begin turning a profit within the next two years. This projection is a response to the surging demand for Bitcoin and other cryptocurrencies, pitting Nomura against established traditional heavyweights such as JPMorgan and Goldman Sachs.
While Laser Digital already offers Bitcoin derivatives to its institutional clientele, the prolonged bear market has impacted the company’s growth trajectory. Due to the recent downturn in cryptocurrency values, Nomura has cautioned that it might take longer than initially anticipated for Laser Digital to achieve profitability.
The cryptocurrency market has witnessed a remarkable surge in the price of Bitcoin, and according to a renowned cryptocurrency analyst, this increase has a fundamental reason: Chinese buying. In a recent YouTube video, the CryptoBanter analyst dissected the factors behind this Bitcoin surge, which comes after a series of significant declines in August. In this report, we will delve into how Chinese buying has propelled the price of Bitcoin and how other factors, such as the depreciation of the Chinese yuan and its correlation with the U.S. Dollar Index (DXY), have influenced this exciting development in the cryptocurrency market.
The Flight from the Chinese Yuan: Bitcoin and Gold as Havens
One of the key factors behind Bitcoin’s recent surge is the increasing flight of Chinese consumers from their national currency. The Chinese currency has experienced depreciation in its value, leading many Chinese individuals to seek refuge in Bitcoin and gold. Economic uncertainty in China, exacerbated by crises in the stock market and the real estate market, has further eroded confidence in the Chinese yuan. As a result, Bitcoin and gold have become safe-haven assets for Chinese investors.
Bitcoin Reaches $32,500 in China
The CryptoBanter analyst reports that the demand for “digital gold” in China has driven Bitcoin’s price to astonishing levels. According to their observations, a single Bitcoin has reached a price of $32,500 in China and was then exchanged for USDT at $33,000. This represents a significant premium compared to the current price of Bitcoin in other markets, which stands at $27,135. This price disparity has created a substantial arbitrage opportunity for investors.
September Breaks the Traditional Bearish Pattern
September is typically a historically bearish month for Bitcoin, but this year has been a notable exception. Despite pessimistic predictions from many analysts, BTC has recorded a 4% increase in its price during this month. The CryptoBanter analyst suggests that this positive performance may foreshadow even greater gains in the future.
Correlation with the U.S. Dollar Index (DXY)
One interesting observation from the analyst is the correlation between the price of Bitcoin and the U.S. Dollar Index (DXY). According to their data, whenever the DXY reaches the level of 105, the price of Bitcoin tends to rise. This could indicate an inverse relationship between the strength of the U.S. dollar and the attractiveness of Bitcoin as an investment asset.
Long-Term Investors Continue to Accumulate
Despite the volatile market conditions, the analyst points out that long-term Bitcoin investors have increased to over 75%. This suggests sustained confidence in the long-term potential of the world’s largest cryptocurrency, even amid price fluctuations.
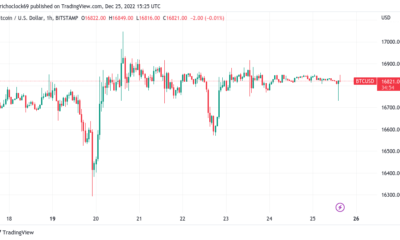
Bitcoin in the Last 24 Hours
According to CoinMarketCap data, in the last 24 hours, Bitcoin has experienced a 0.79% increase. On the weekly price chart, the leading cryptocurrency has risen by 4.56%. At the time of writing this report, Bitcoin has a market capitalization of $528 billion, solidifying its position as the largest and most robust cryptocurrency network in the world.
In Conclusion…
Chinese buying has proven to be a crucial factor in the recent surge of Bitcoin, challenging the traditionally bearish expectations for September. As the cryptocurrency continues to evolve and attract the attention of investors worldwide, the relationship between Bitcoin and global economic events will remain a topic of interest and discussion within the crypto community.

In an exciting revelation, prominent cryptocurrency analyst Michaël van de Poppe has shared his insightful analysis of Chainlink (LINK), one of the standout cryptocurrencies in today’s market. Van de Poppe, widely recognized in the crypto community, has caused a stir with his bullish predictions for this decentralized oracle network. Let’s delve into the details of his analysis and understand why he foresees a bright future for Chainlink.
Van de Poppe’s Chainlink Analysis
According to Van de Poppe’s analysis, Chainlink has reached its minimum level and is poised for a reevaluation phase that could offer extremely lucrative buying opportunities. His expert view focuses on a specific price range: $6.15 to $6.40. For investors, this range presents itself as a strategic entry point that could result in substantial gains in the near future. Van de Poppe has even set an ambitious price target of $8, suggesting an impressive bullish potential.
Technical Analysis: Bullish Outlook
Chainlink’s technical analysis supports Van de Poppe’s claims. The 4-hour chart for LINK/USD reveals that the altcoin remains above all moving averages, a positive indicator of the current bullish trend. Furthermore, the chart shows that Chainlink is struggling to break above the upper band of its symmetrical triangle pattern, which could mark the beginning of a significant rally.
The MACD indicator also lends support to the idea of a bullish breakthrough, with two consecutive higher highs indicating an upward momentum. Although the RSI remains neutral, it is above the 50 level, suggesting room for further growth in Chainlink’s price.
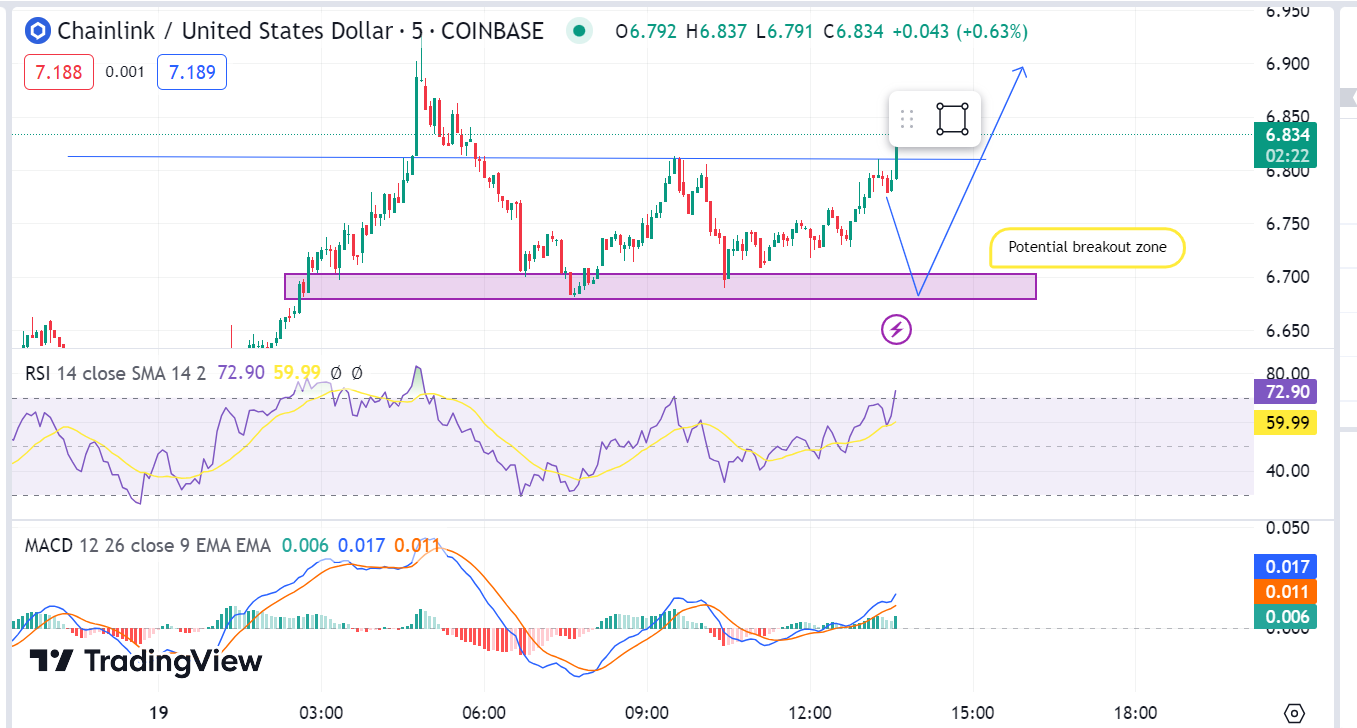
Key Levels and Resistance
In recent days, bears attempted to push Chainlink’s price below $6.55, but strong buying pressure at this level prevented a significant decline. This demonstrates the strength of buyers in the area. After this attempt at a downward correction, the price returned and reached the supply zone at $6.68. At this point, several double-bottom patterns were observed, a bullish indicator according to technical analysis.
Chainlink’s Potential
The pivotal moment came in the previous 4-hour timeframe when bulls gained momentum by surpassing the resistance at $6.70. This bullish breakthrough led the price to steadily rise, reaching an intraday high of $6.88, which is close to the 200-exponential Moving Average (EMA), a significant technical indicator.
However, as in any financial market, there is always the possibility that bulls may lose their momentum. In that case, we could see a retracement to the main support level at $6.45. If this level fails to hold, a more significant correction to $6.0 is possible, potentially opening the door to a bearish trend.
Conclusion
In summary, Michaël van de Poppe, with his impressive track record of predictions, has put Chainlink on the radar of many investors. His technical analysis supports his bullish outlook and highlights key levels to watch. As this cryptocurrency continues to attract attention in the crypto community, investors will be eager to see if Chainlink lives up to expectations and reaches new highs on its exciting journey towards $8 and beyond. Stay tuned for market updates, as exciting opportunities can arise in the world of cryptocurrencies.

Shiba Inu: Celebration for the Burning of 176 Million SHIB in a Historic Transaction

Nomura Group Unveils Bitcoin Fund Catering to Institutional Investors

Bitcoin Surges to $32,500 in China: Here’s Why

US National Debt Reaches a Record of $33 Trillion: Economic Crisis in Perspective

This Analyst Predicts a Bright Bullish Future for Chainlink (LINK)

FTX Files Lawsuit Against Sam Bankman-Fried’s Parents in Effort to Recover Funds
Crypto Enforcement Funds Under Scrutiny: Congressman Emmer Calls For Restrictions On SEC
These 3 AI Crypto Coins are Bullish in 2023 – Render, Fetch.ai, yPredict
-

 Opinion2 years ago
XRP: FOX Business Senior Correspondent Says SEC Is Losing Its Lawsuit Against Ripple
-

 Tutorials3 years ago
How to Earn, Farm and Stake CAKE on PancakeSwap with Trust Wallet
-
Altcoins News3 years ago
Projects with ongoing migration from Ethereum to Cardano
-
NFT3 years ago
CardanoKidz: The first NFTs arrive at Cardano
-
Tutorials3 years ago
How to set up a Bitcoin node: beginner’s guide
-
NFT3 years ago
SpaceBudz: new astronaut NFTs on Cardano
-
DeFi News3 years ago
Uniswap vs PancakeSwap: Full analysis
-
DeFi News3 years ago
Liqwid Finance the first DeFi project on Cardano: everything you need to know