Analysis
Litecoin price reaches 3-year high due to increasing network activity

Litecoin rose to $195 before sellers pushed it down to $180.
Current Litecoin rate
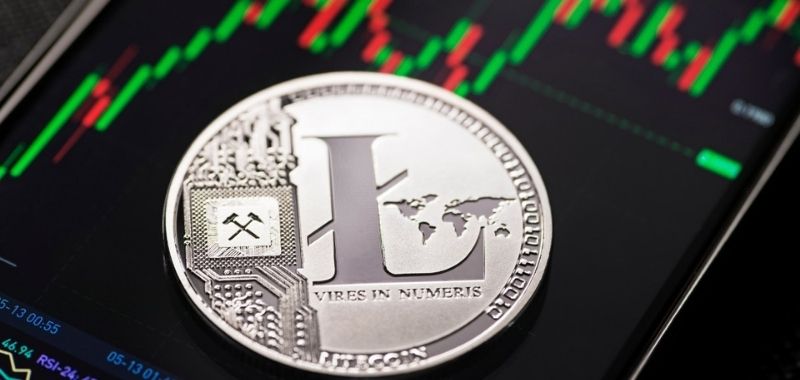
Litecoin is among several altcoins that shone as Bitcoin pulled back from its recent all-time high. The cryptocurrency mirrored other big winners like Binance Coin, Cardano and ChainLink.
LTC price hit a high of 195 on Wednesday before correcting gains amid a lull in the broader market. The move was the highest Litecoin price level in nearly three years. The last time LTC/USD traded at the $195 level was in March 2018.
Litecoin price rose as the network grew
At the time of writing, LTC is trading at $186. The price is about 3% lower than its 24-hour opening price, but it has been trading more than 22% higher for the past seven days.
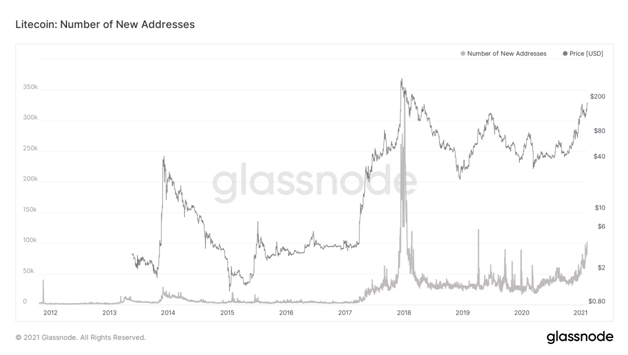
This rise in Litecoin price coincides with an increase in network activity, according to data from the on-chain analytics platform Glassnode. According to the company, the active addresses rose to 231,973 and thus to a new high, which represents the greatest growth since June 5, 2020.
There has also been an increase in new addresses. The increase to 101,862 was the highest value since April 2019. The increase in new addresses is an important measure. It suggests that more investors have joined the network, increasing the momentum on the buyer side.
Litecoin price outlook
LTC/USD
Litecoin (LTC) failed to maintain momentum after hitting the multi-year high of $195. This is illustrated by the previous candle holder. The bears’ aggression seems to have evaporated. Bulls appear energized after purchasing the dip.
Currently, the main bull target is to extend gains above the $186 resistance level. This would allow them to retest the February 10th intraday highs. If the stubbornness of the sellers is broken, the upward move will likely push LTC/USD above $200 and see the coin level off above $220.
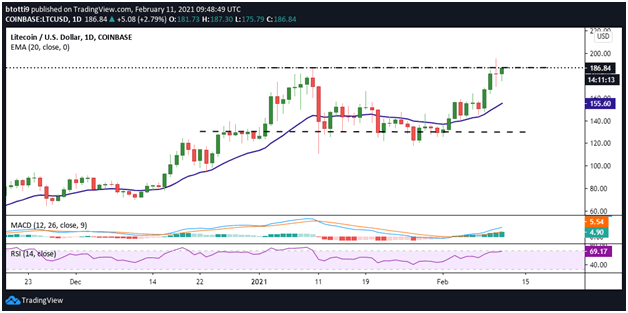
The MACD and RSI indicators are giving bulls the upper hand, with prices above $250 offering a legitimate short-term target.
However, bears should see another big sell-off if prices hit the above levels.
If bulls don’t hold LTC/USD above $185, a higher profit booking could accelerate a retreat towards the 20-day exponential moving average. The EMA offers a buffer zone for $155.
If the consolidation is not above the price level, a horizontal support line of $130 can remain as the main anchor. A breakdown beyond this support line could tip LTC/USD towards $100.
Analysis
XRP price analysis: Failure at $0.50 could take XRP to $0.34

If XRP price drops below $0.50, losses could extend to $0.34
The XRP price remains in the $0.50-0.65 range, which is reasonably positive for XRP bulls as most other assets have seen massive sell-offs in the past 24 hours.
Bitcoin (BTC) corrected 17% to break below $50,000. The coin hit lows of $47,000 yesterday. Ethereum price also fell sharply to test $1,650 again, dampening bullish sentiment surrounding its breakout to $2,036. Most of the other altcoins posted double-digit losses – including Binance Coin, Polkadot, and Litecoin.
While the XRP/USD pair may still bounce off the $0.50 mark, insufficient upward momentum during the early trading session is putting pressure on the bulls. This is the technical picture for XRP/USD.
Daily chart at XRP price
After breaking down from highs of $0.57, the XRP bulls were unable to gain control above $0.5250. Navigating the region is proving persistent as sellers have already pushed prices back to the $0.50 support several times this morning.
If the new buy dynamic XRP pushes past the $0.57 and $0.65 resistance levels, the next target is at $0.78.
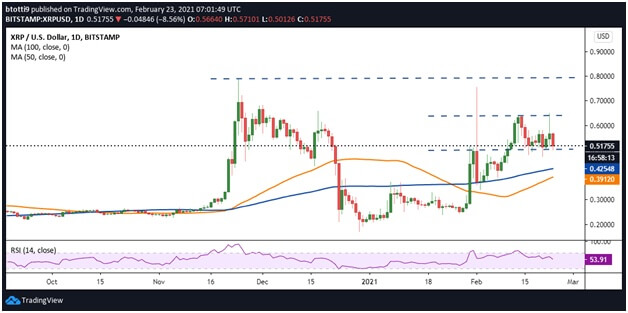
Although the XRP/USD pair remains in the $0.50-0.65 range, bulls need to keep the support level intact in order not to lose control to sellers. If prices drop below $0.50, XRP could drop to lows of $0.34.
This could be the case as the daily RSI will appear to drop below 50. If bears take control of heightened selling pressures, another correction could force bulls to defend gains around the 100-SMA ($0.4254) and 50-SMA ($0.3912) as support areas.
XRP price in the 4-hour chart
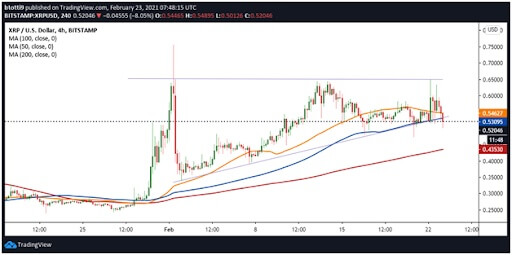
On the 4-hour chart, XRP price has fallen below the 50-SMA ($0.5427) and 100-SMA ($0.5309). Bears also seek to extend losses below a crucial support trendline from an old ascending triangle.
If bulls rebound and push higher, rolling back the simple 50 and 100 moving averages could help drive prices to $0.60 and the resistance line of the ascending triangle to $0.65.
Conversely, if XRP / USD falls below $ 0.50, the immediate losses could extend to the 200 SMA at $0.4353 and then to the monthly XRP low of $0.34.
At the time of writing, bulls are trying to keep sellers off just above $0.50, adding to the downside risk.
Analysis
Binance Coin price jumped 48% reaching a new high above $190

Binance Coin (BNB) price rose 48% to a new all-time high of $196, with bulls expected to see $200 shortly.
Current Binance Coin course
Binance Coin (BNB) is up 48% in the past 24 hours to hit a new all-time high of $196. BNB price is up more than 330% this month after trading at around $44 on February 1.
According to the fundamental and technical picture for BNB/USD, a break above $200 could follow after a short break.
The native coin of the Binance ecosystem, including the Binance Smart Chain, is now the fourth largest cryptocurrency by market capitalization. According to CoinMarketCap, the BNB cap is now $29.7 billion, placing the Binance Coin ahead of Polkadot (DOT), Cardano (ADA) and XRP.
Binance price rises thanks to strong Binance Smart Chain
As Santiment recently pointed out, given the increased number of addresses with 100,000 or more tokens, the BNB price has increased. For example, in August 2020 there were only 26 such addresses, but in mid-January 2021 the number rose to 48. Around this time, the BNB price had its “initial start”.
The growth of the Binance Smart Chain (BSC) appears to be another spark that sparked the recent BNB rally. The DeFi (Decentral Finance) project launched in September 2020 was used extensively by users.
More daily transactions are now recorded than on the Ethereum network. The inheritance continues when the unique address metric increases.
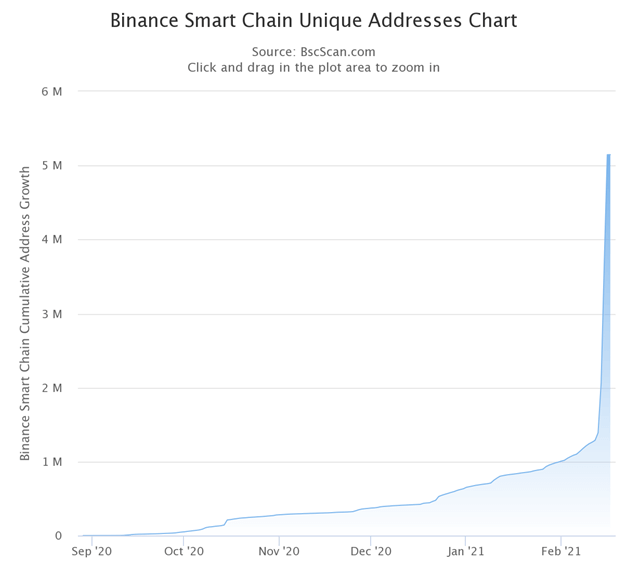
On February 16, Binance CEO Changpeng Zhao posted the following on BSC.
“There are currently more daily transactions on #BSC than on the ETH network. Soon the total processed on #BSC will also surpass ETHs. Only a matter of time. #BNB (I’m not against ETH. I support the growth of both)”.
The Binance CEO now believes the BSC rollout is only just beginning.
“I think #BSC has passed the tipping point. Now all wallets and other tool manufacturers want better and native support for #BSC and not just for a #ETH variant. Now a virtual cycle starts”.
Binance Coin course: what’s next?
BNB price is well above a bearish trendline that had limited growth to $130. The price action on the 4-hour chart shows that BNB/USD broke across several resistance levels on the way to the high of $196.
A new level of support is at the 0.236 Fibonacci retracement level ($179.87), which could be the springboard for higher prices. If bulls break above the immediate resistance around $188, they can retest the intraday high and even climb to a new record above $200.
Both the MACD and RSI over the 4 hour period strengthen the potential for further gains.
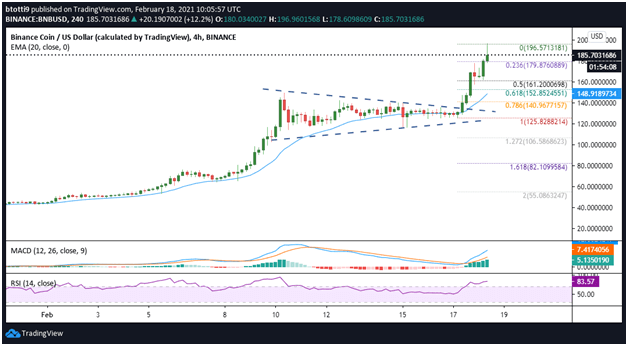
On the flip side, the near-term outlook suggests bulls are getting solid support at $165, the 0.5 Fibonacci level ($161.20) and the 0.618 Fib level ($ 152.85). If the downward pressure builds in the short term, the BNB / USD pair could count on strong support at the 20 EMA (4 hours) which is currently at $149.21.
Analysis
Bitcoin astonishingly close to $50,000: BTC could do that now

BTC rose to $49,714, just below the coveted $50,000 level.
Bitcoin (BTC) hit nearly $50,000 this weekend as bulls rose from weekly lows of $38,870 to a new all-time high of $49,714.
Although the crypto reserve currency weakened somewhat on Monday morning and briefly fell to lows of $45,914, bulls tried to regain control. At the time of writing, the BTC price is $47,512.
Bitcoin price rises because a lot of money flows
The astonishing rise in Bitcoin price follows an extremely optimistic mood in a week in which MasterCard, among others, announced future support for the Bitcoin.
On Friday, Twitter CEO Jack Dorsey and rapper Jay Z added the bullish outlook as they unveiled an upcoming Bitcoin development fund focused on rollout in India and Africa. Previously, Tesla’s announcement of a $ 1.5 billion BTC stake had resulted in prices near the $50,000 level.
A look at the technical picture of Bitcoin suggests that the cryptocurrency will continue its impressive performance in 2021.
CryptoQuant CEO Ki Young Ju predicts another step up and points to the increased inflows of stablecoins on exchanges.
“If you are a long term investor, now is the time to buy $ BTC. It’s unclear how many fixes would be on the way, but the on-chain indicator says there are enough stablecoins on exchanges compared to bitcoins to keep going up”. he explained.
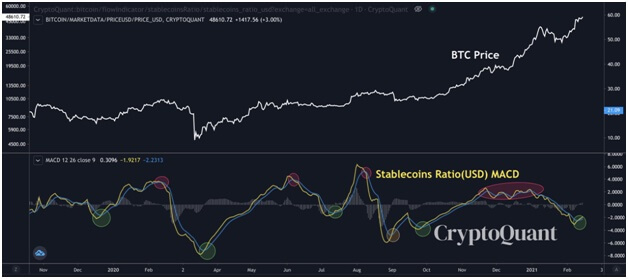
The outlook suggests that investors expect the Bitcoin price to rise in the next few sessions.
Bitcoin price: BTC/USD
Bulls are likely to be supported by a hidden bullish divergence suggested by the Relative Strength Index. The stochastic RSI is also grossly oversold. This, in turn, suggests that the upward path is the more likely immediate path.
Bitcoin price has shown promises above $47,000 and formed consecutive green candles above support for the ascending trendline. On the upside, buyers have retested the resistance around $47,500. This is a level indicated by the 20-day EMA on the 4-hour chart.
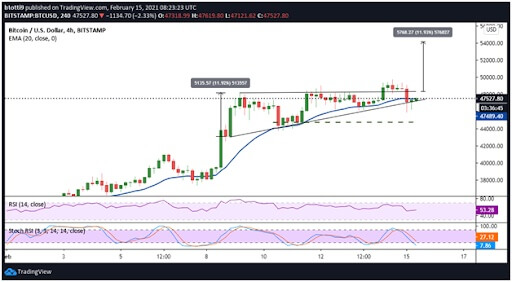
If bulls push higher on the horizontal resistance line of the old ascending triangle pattern, a bullish breakout could emerge. Here, upward momentum above $48,000 could catapult the BTC price to the coveted level of $50,000. By breaching this psychologically important hurdle, BTC can likely target highs of $54,000 within the week.
In the scenario where bears face more of a challenge, a drop to $46,000 and then to $45,500 is likely. Bulls could use this level to reload and keep bears away. The likely outlook is a phase of consolidation with the BTC/USD pair trading sideways for a short period of time.
A rebound above the parallel upward channel could give buyers an opportunity to retest recent highs. On the other hand, a breakdown from here would mean a short-term decline in support areas at $44,500 and $43,200, respectively.
-
Opinion2 years ago
XRP: FOX Business Senior Correspondent Says SEC Is Losing Its Lawsuit Against Ripple
-
Tutorials3 years ago
How to Earn, Farm and Stake CAKE on PancakeSwap with Trust Wallet
-
Altcoins News3 years ago
Projects with ongoing migration from Ethereum to Cardano
-
NFT3 years ago
CardanoKidz: The first NFTs arrive at Cardano
-
Tutorials3 years ago
How to set up a Bitcoin node: beginner’s guide
-
NFT3 years ago
SpaceBudz: new astronaut NFTs on Cardano
-
DeFi News3 years ago
Uniswap vs PancakeSwap: Full analysis
-
DeFi News3 years ago
Liqwid Finance the first DeFi project on Cardano: everything you need to know

