Analysis
XRP price analysis: Failure at $0.50 could take XRP to $0.34

If XRP price drops below $0.50, losses could extend to $0.34
The XRP price remains in the $0.50-0.65 range, which is reasonably positive for XRP bulls as most other assets have seen massive sell-offs in the past 24 hours.
Bitcoin (BTC) corrected 17% to break below $50,000. The coin hit lows of $47,000 yesterday. Ethereum price also fell sharply to test $1,650 again, dampening bullish sentiment surrounding its breakout to $2,036. Most of the other altcoins posted double-digit losses – including Binance Coin, Polkadot, and Litecoin.
While the XRP/USD pair may still bounce off the $0.50 mark, insufficient upward momentum during the early trading session is putting pressure on the bulls. This is the technical picture for XRP/USD.
Daily chart at XRP price
After breaking down from highs of $0.57, the XRP bulls were unable to gain control above $0.5250. Navigating the region is proving persistent as sellers have already pushed prices back to the $0.50 support several times this morning.
If the new buy dynamic XRP pushes past the $0.57 and $0.65 resistance levels, the next target is at $0.78.

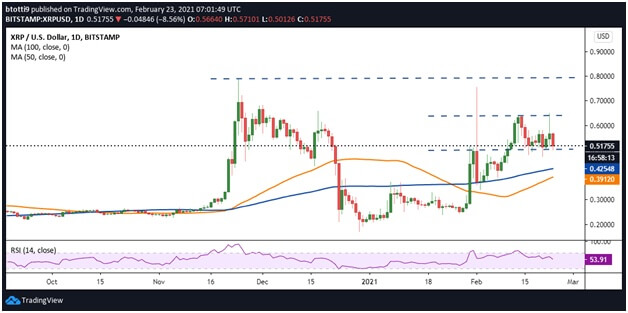
Although the XRP/USD pair remains in the $0.50-0.65 range, bulls need to keep the support level intact in order not to lose control to sellers. If prices drop below $0.50, XRP could drop to lows of $0.34.
This could be the case as the daily RSI will appear to drop below 50. If bears take control of heightened selling pressures, another correction could force bulls to defend gains around the 100-SMA ($0.4254) and 50-SMA ($0.3912) as support areas.
XRP price in the 4-hour chart

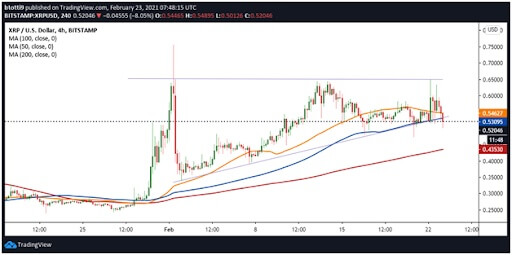
On the 4-hour chart, XRP price has fallen below the 50-SMA ($0.5427) and 100-SMA ($0.5309). Bears also seek to extend losses below a crucial support trendline from an old ascending triangle.
If bulls rebound and push higher, rolling back the simple 50 and 100 moving averages could help drive prices to $0.60 and the resistance line of the ascending triangle to $0.65.
Conversely, if XRP / USD falls below $ 0.50, the immediate losses could extend to the 200 SMA at $0.4353 and then to the monthly XRP low of $0.34.
At the time of writing, bulls are trying to keep sellers off just above $0.50, adding to the downside risk.