Analysis
Bitcoin astonishingly close to $50,000: BTC could do that now

BTC rose to $49,714, just below the coveted $50,000 level.
Bitcoin (BTC) hit nearly $50,000 this weekend as bulls rose from weekly lows of $38,870 to a new all-time high of $49,714.
Although the crypto reserve currency weakened somewhat on Monday morning and briefly fell to lows of $45,914, bulls tried to regain control. At the time of writing, the BTC price is $47,512.
Bitcoin price rises because a lot of money flows
The astonishing rise in Bitcoin price follows an extremely optimistic mood in a week in which MasterCard, among others, announced future support for the Bitcoin.
On Friday, Twitter CEO Jack Dorsey and rapper Jay Z added the bullish outlook as they unveiled an upcoming Bitcoin development fund focused on rollout in India and Africa. Previously, Tesla’s announcement of a $ 1.5 billion BTC stake had resulted in prices near the $50,000 level.
A look at the technical picture of Bitcoin suggests that the cryptocurrency will continue its impressive performance in 2021.
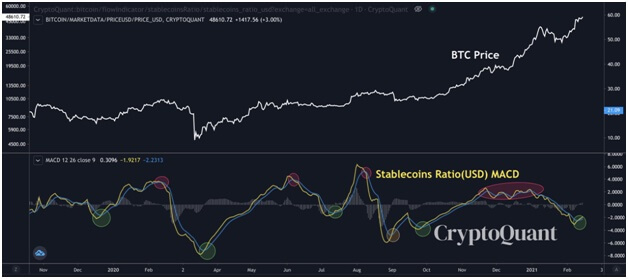
CryptoQuant CEO Ki Young Ju predicts another step up and points to the increased inflows of stablecoins on exchanges.
“If you are a long term investor, now is the time to buy $ BTC. It’s unclear how many fixes would be on the way, but the on-chain indicator says there are enough stablecoins on exchanges compared to bitcoins to keep going up”. he explained.

The outlook suggests that investors expect the Bitcoin price to rise in the next few sessions.
Bitcoin price: BTC/USD
Bulls are likely to be supported by a hidden bullish divergence suggested by the Relative Strength Index. The stochastic RSI is also grossly oversold. This, in turn, suggests that the upward path is the more likely immediate path.
Bitcoin price has shown promises above $47,000 and formed consecutive green candles above support for the ascending trendline. On the upside, buyers have retested the resistance around $47,500. This is a level indicated by the 20-day EMA on the 4-hour chart.

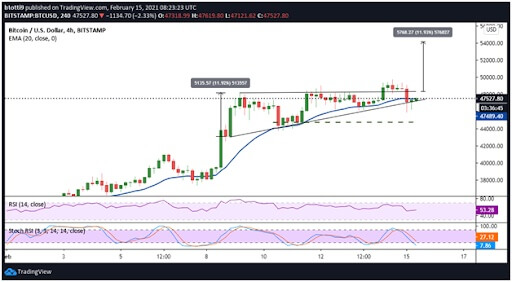
If bulls push higher on the horizontal resistance line of the old ascending triangle pattern, a bullish breakout could emerge. Here, upward momentum above $48,000 could catapult the BTC price to the coveted level of $50,000. By breaching this psychologically important hurdle, BTC can likely target highs of $54,000 within the week.
In the scenario where bears face more of a challenge, a drop to $46,000 and then to $45,500 is likely. Bulls could use this level to reload and keep bears away. The likely outlook is a phase of consolidation with the BTC/USD pair trading sideways for a short period of time.
A rebound above the parallel upward channel could give buyers an opportunity to retest recent highs. On the other hand, a breakdown from here would mean a short-term decline in support areas at $44,500 and $43,200, respectively.